Map
User can open maps by clicking this ![]() icon in user home page.
icon in user home page.
BASEMAP
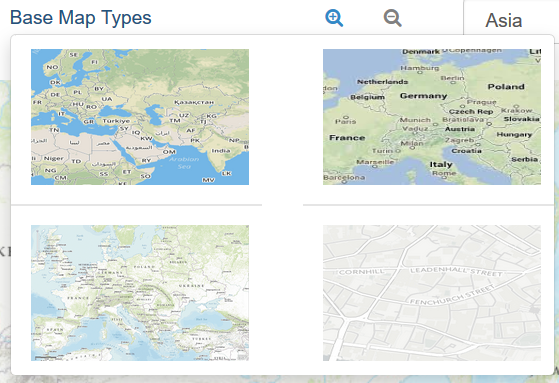
User may select a basemap on which user will plot customers, facilities etc.
There are 4 types of base maps available:
- Streets: The Streets basemap presents a multiscale street map for the world.
- National Geographic: The National Geographic basemap is designed to be used as a general reference map for informational and educational purposes.
- Grey: The Light Grey Canvas basemap is designed to be used as a neutral background map for overlaying and emphasizing other map layers.
- Topographic: The Topographic map includes boundaries, cities, water features, physiographic features, parks, landmarks, transportation, and buildings.
MAP FRAME
Map frames are containers for maps on your page. They can point to any map or scene in your project.
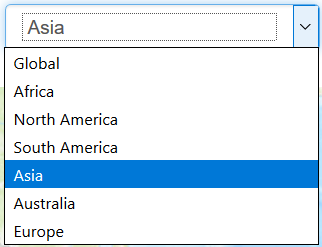
By default, system provides 7 map frames:
- Global
- Africa
- North America
- South America
- Asia
- Australia
- Europe
User may define custom map frame by zooming in on the area for which user wants to define map frame and then click on  button on the bottom of the map.
button on the bottom of the map.LAYER NAVIGATOR
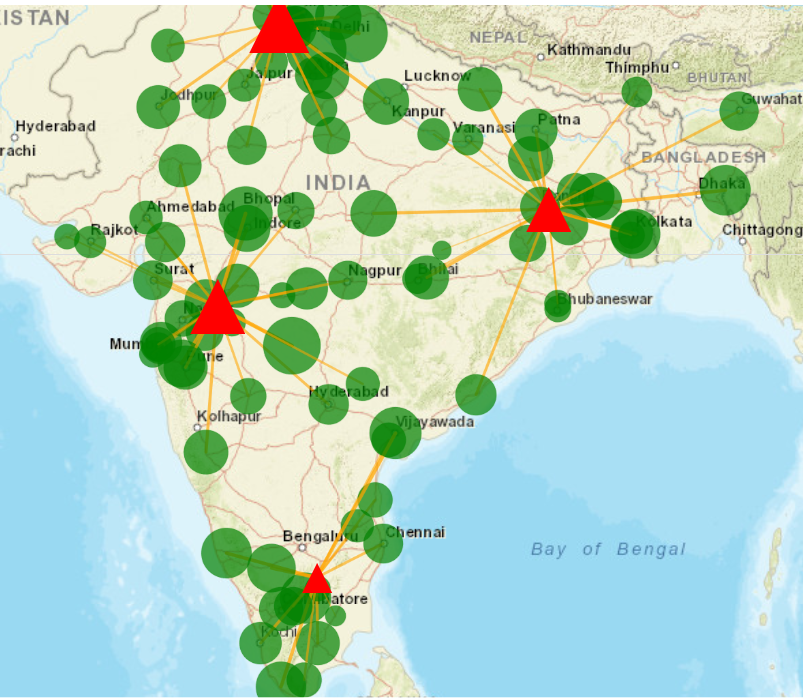
Layer navigator plots links and locations based on Customer Flows and Interfacility Flows output table, user may filter out data to plot on map using filters:
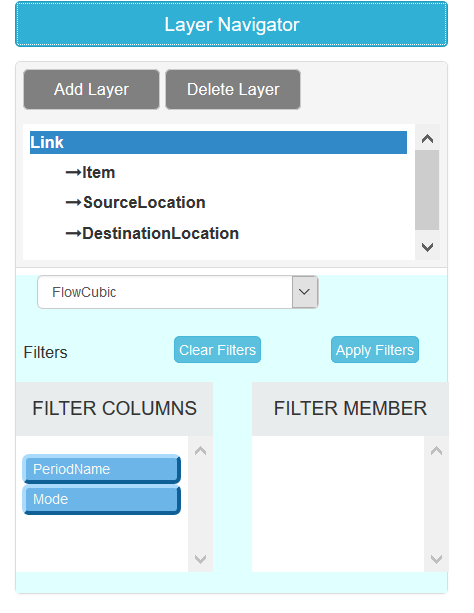
Components Details:
- Link: User needs to choose what metric to be displayed for flows: Flow Units/Flow Weight/Flow Cubic User may also apply filter for one or more period or modes.
- Item: User can apply filter for one or more items and user defined column members.
- Source Location: User can apply filter for one or more locations, geographies, and user defined column members.
- Destination Location: User can apply filter for one or more locations, geographies, and user defined column members.
GENERATE GRID
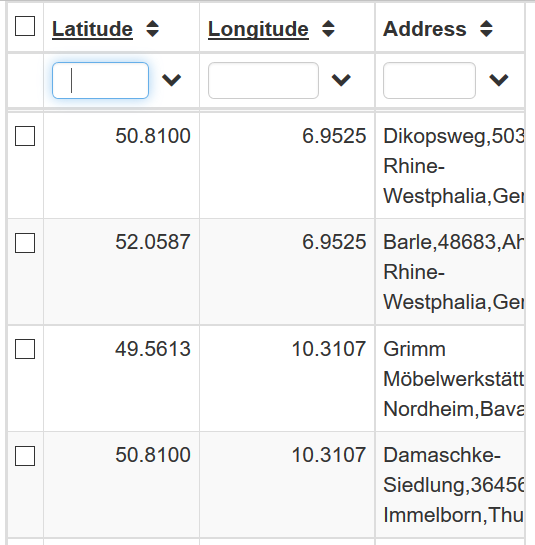
User may create a grid of max (25X25) points on map to extract the coordinates of grid centre points and their addresses in Grid Locations output table.
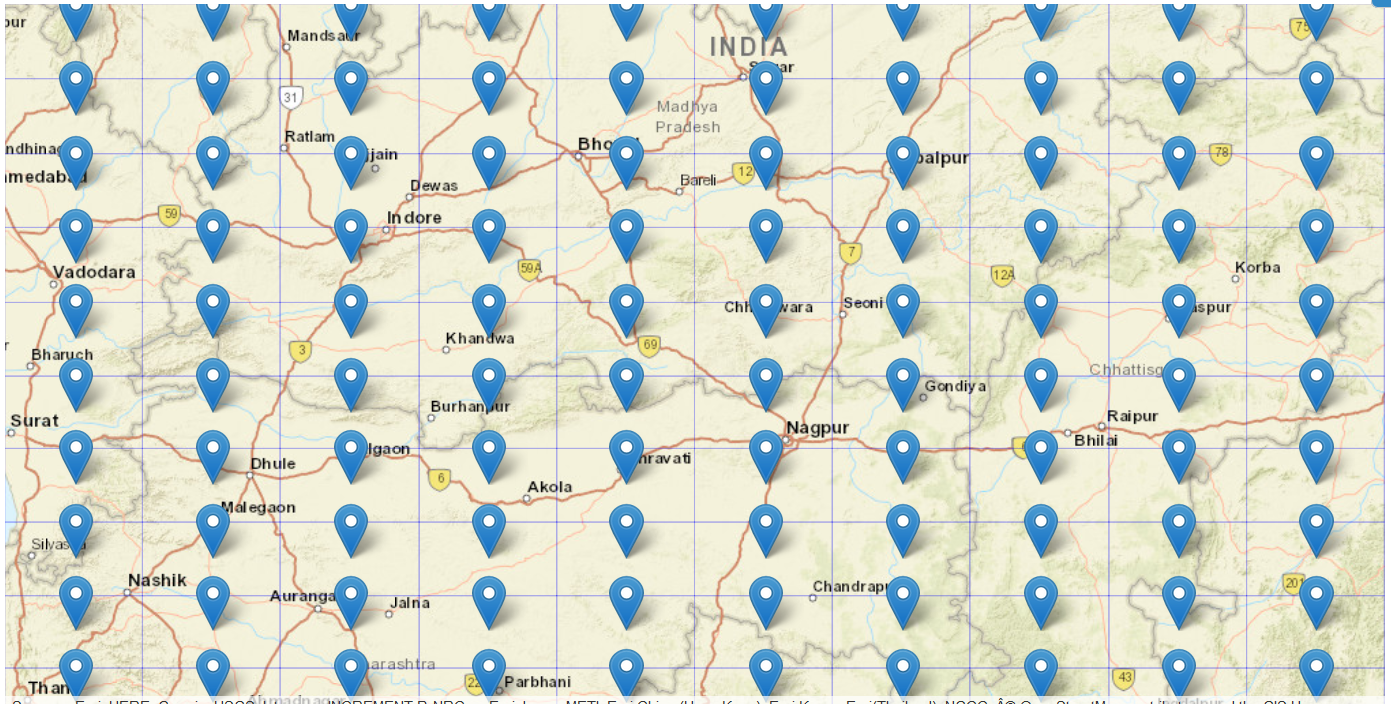
User may also enable or disable a grid location by clicking on it.
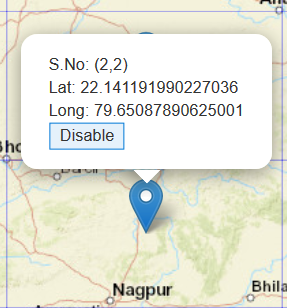
After clicking on Get address of Mid Points, system will populate Grid Locations table.
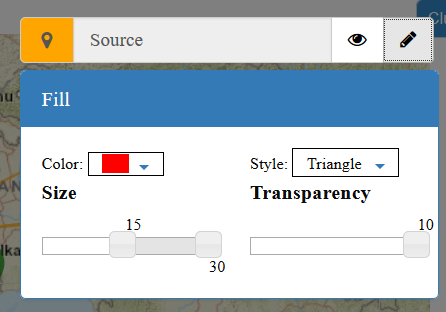
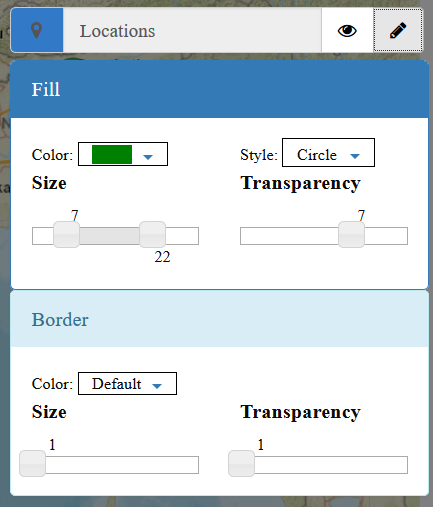
DISPLAY OPTIONS
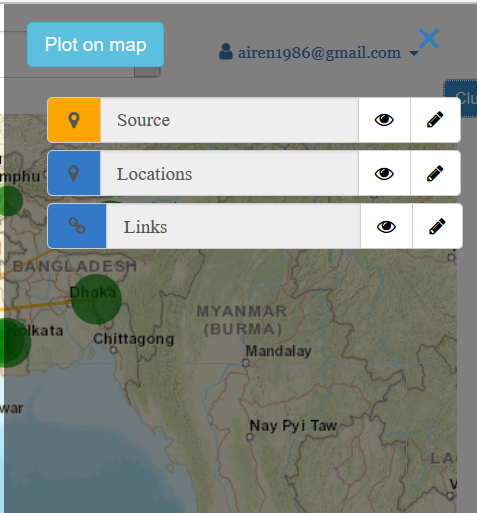
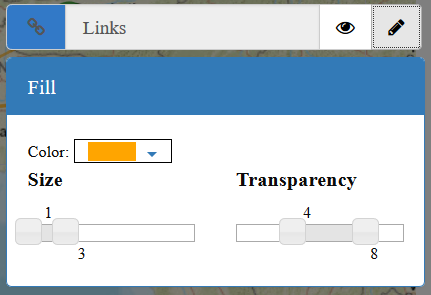
User may choose to plot shape, size, colour and transparency of source location, destination location and links.
- Source: User may change the display of source location by click on
icon. User may select colour, shape, size and transparency.
- Location: Similar to source, user may change display for destination location.
- Link: User may change colour, size and transparency of the link. Based on min max parameters and flow unit/flow weight/flow cubic, system will plot link width and transparency.